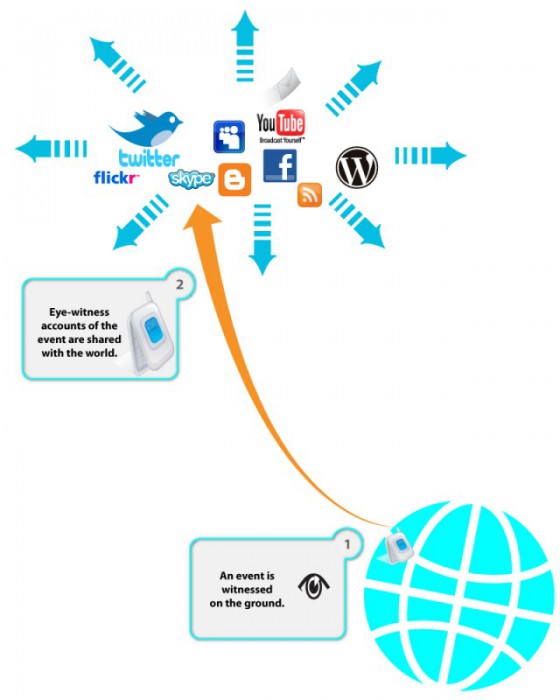
I’m working on a series of illustrations to highlight the need for decision scaffolding during an aide mission. The ideas are based on the Ushahidi deployment experience in Haiti after the 2009 earthquake. But the idea is to make this more general. I would love ideas and recommendations on how to make this visualization better and more communicative. (read more about crisis mapping here) Crisis: Smoke Signals from Eye-Witnesses Let’s start with a crisis—a natural disaster or a political upheaval leaves thousands of people in desperate need of help. The people on the ground witness the suffering and use ICT (Information Communication Technology) to send up the spoke signals. Please not that Internet services might be compromised (due to deliberate actions taken by the authorities; infrastructure failures; chaotic conditions on the ground), but people tend to be very creative and use phone lines, radios, satellite links, and just person to person communication to get the information out there. During the current Libyan crisis, people were very creative: “To avoid detection by Libyan secret police, who monitor Facebook and Twitter, Mahmoudi, the leader of the Ekhtalef (“Difference”) Movement, used what’s considered the Match.com of the Middle East to send coded love…
Tag Archive for Crisis Mapping
Background Knowledge, Conceptual Design, Pipsqueak Articles, Reference
Micro Introduction to Crisis Mapping
by Olga Werby •
Crisis Mapping Crisis mapping is a relatively new field—there’s not much research, no journal, and the Harvard Humanitarian Initiative (HHI) and the Department of Political Science at John Carroll University (JCU) jointly hosted the first International Conference on Crisis Mapping only in October 2009. So this is a NEW field of study and practice, but there is a thriving group of practitioners with Patrick Meier (one of the developers of Ushahidi) being one of the leading members. Since I’m working on organizing a conference proceedings for ICT & Human Rights, it seemed necessary to define a few terms in this subject area filled with TLA (three letter acronyms). There are some important terms that are being developed to help parse the field and make sense of the different aspects of the problem. Here’s a breakdown: Crisis Mapping can be divided into three main components: Crisis Map Sourcing (CMS)—this is all about data point collection Crisis Map Coding (CMC)—refers to entering the data points by hand, based on analysis of news, police reports, blogs, and so on, but the person entering the data is a professional Participatory Crisis Mapping (PCM)—refers to data points entered by the population in crisis, requires people…